
ORCL closes at 128.23, 60.2% below its Oct 16, 2025 high and 20.0% under its 200-day average
Nathan says Oracle was hit hardest by the OpenAI news and is raising debt with Broadcom to fund OpenAI custom chips. The chart shows a slide older than one headline: ORCL is 11.6% below its 50-day average, 20.0% below its 200-day, and down 34.2% this year.
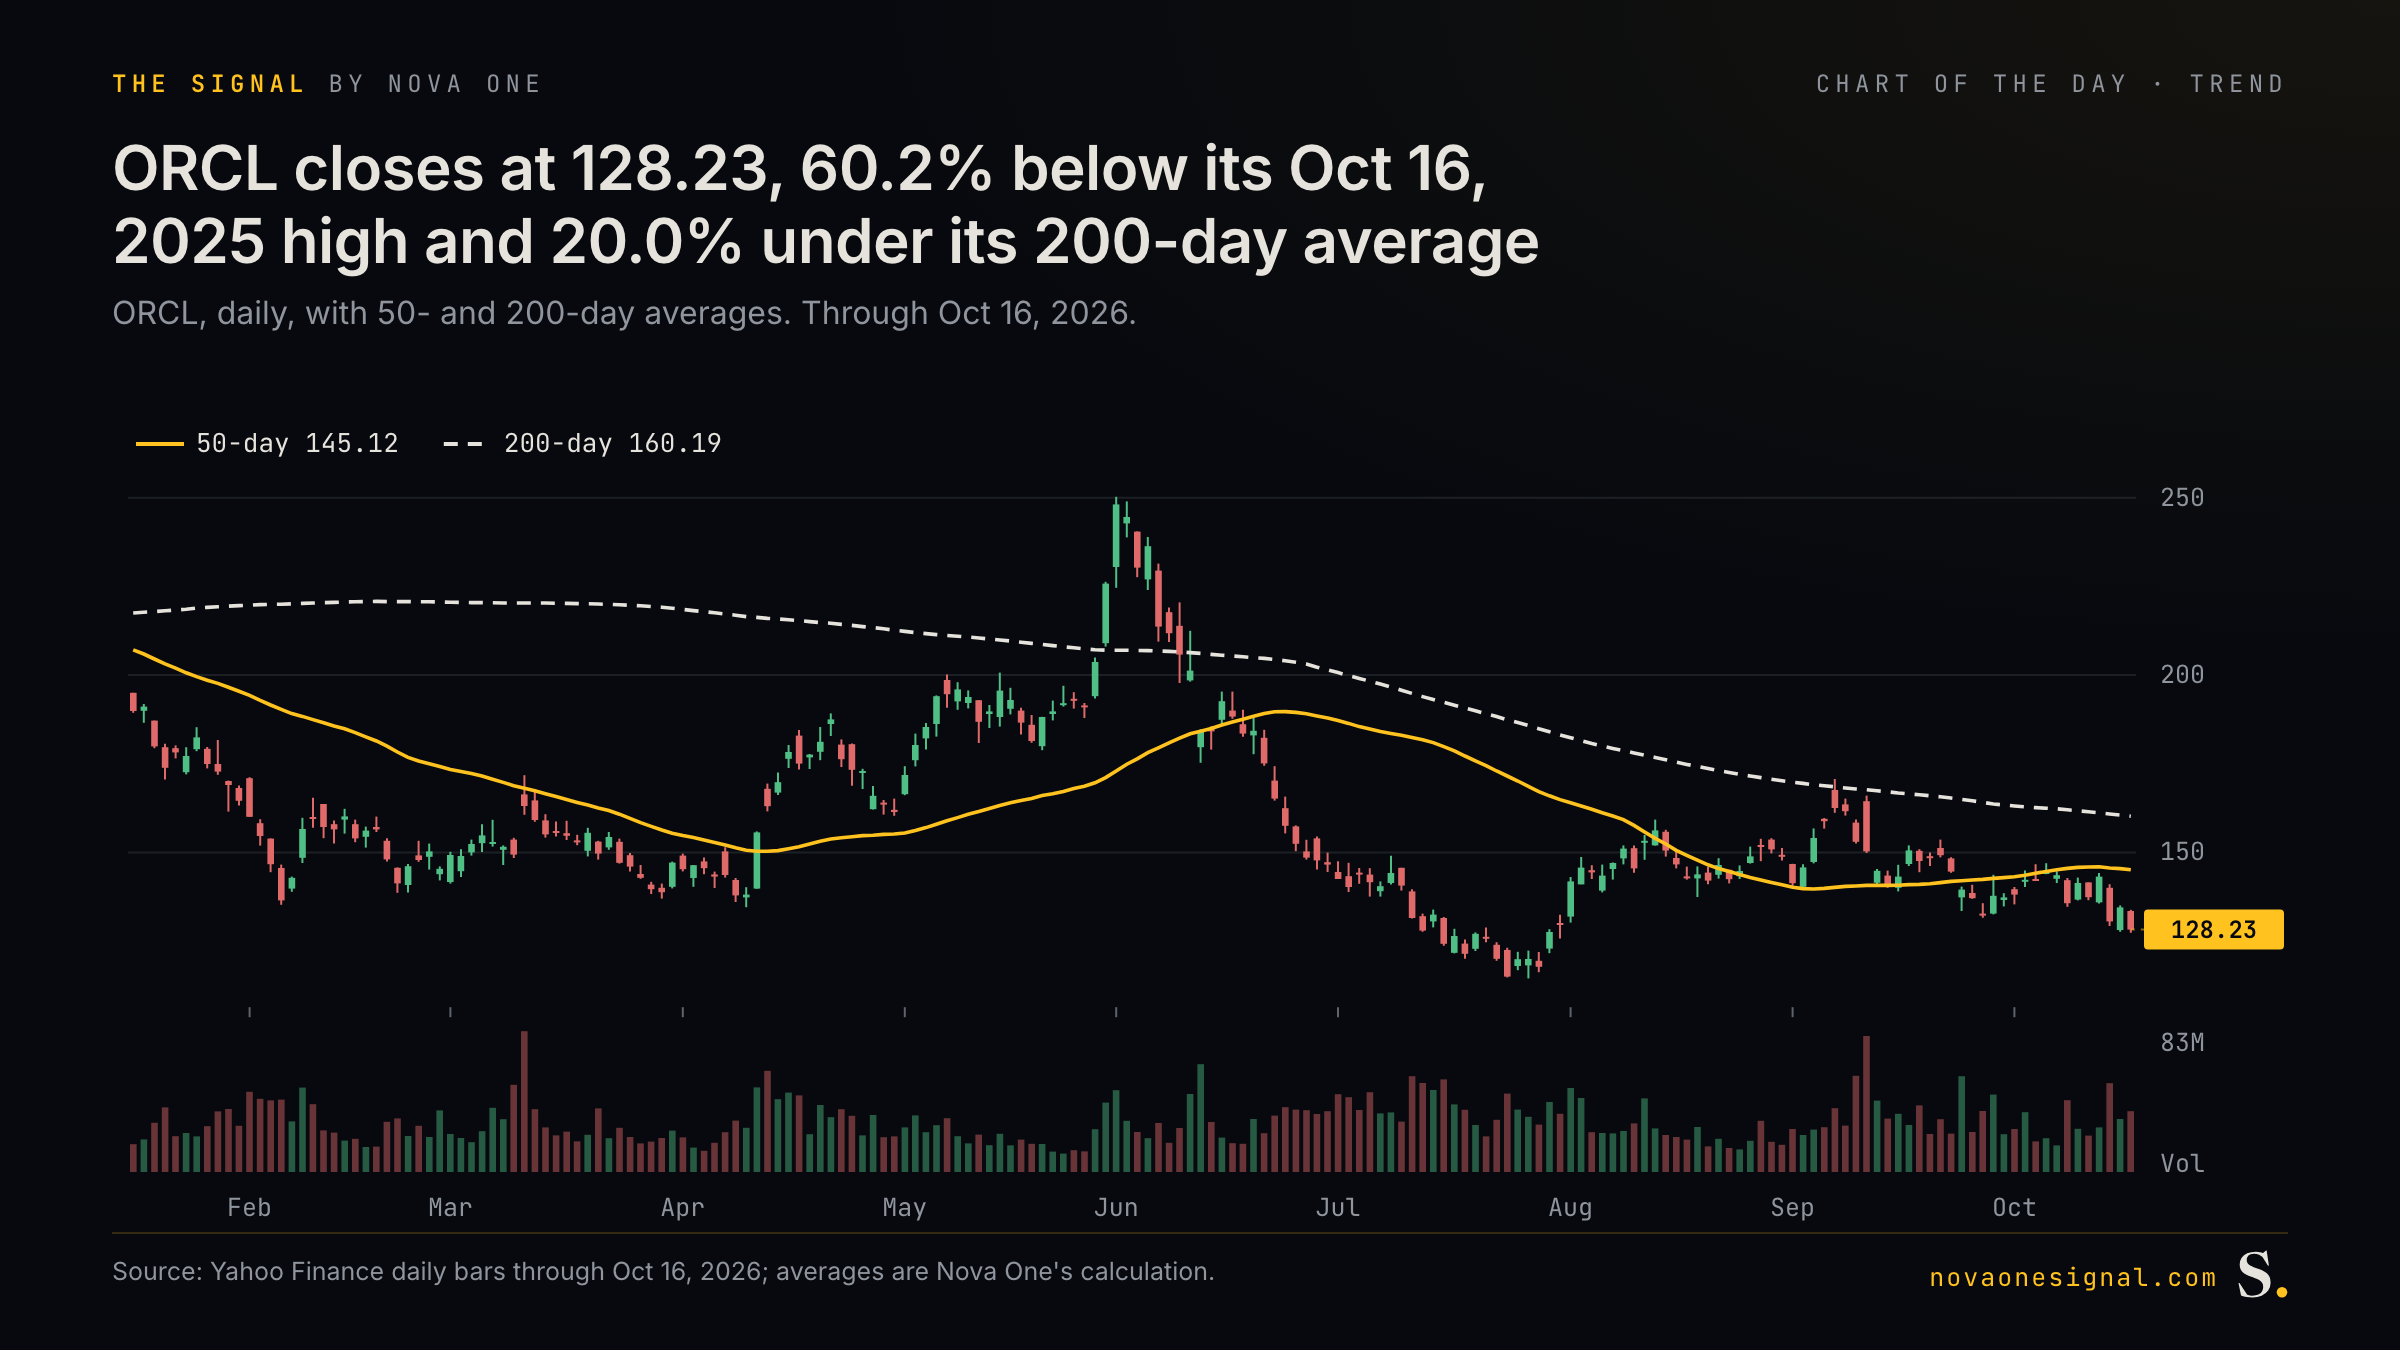
About nine months of daily trading in ORCL. Each candle is one session, with volume underneath. The two lines are the 50-day and 200-day moving averages, the market's short and long trend lines: price above both is an uptrend, below both a downtrend. The tag on the right is the last close.
One news day rarely explains a stock down more than half from its high. The 20.0% gap to the 200-day is wider than the 11.6% gap to the 50-day, so the selling built up over months.
Dan Nathan on RiskReversal Pod: Oracle was hit hardest by the OpenAI news, and with Broadcom is raising about $50B of debt to fund OpenAI custom chips.
RiskReversal Pod, Dan NathanORCL closed at 128.23, 60.2% below its 52-week high set Oct 16, 2025. It sits 11.6% below its 50-day average and 20.0% below its 200-day.
The OpenAI news landed on a stock already in a long decline. The gap to the 200-day is wider than the gap to the 50-day, which points to months of selling.
Get The Signal by email
Two letters a week: a Mid-Week Check-In on Wednesdays and a Week in Review on Saturdays.
We use your address only to send The Signal. Unsubscribe any time. Privacy
Source: Yahoo Finance daily bars through Oct 16, 2026; averages are Nova One's calculation. Every number on the chart is computed from the source data in the same run that drew it. The Signal is research, not investment advice. How we work · Disclosures